A collage of various electronics and robotics parts featuring Arduino boards, sensors, wires, a motor assembly, and a small outdoor rover with a pinwheel mounted on top.
2.4K+

dallas isd students impacted

4

schools trialing rover

22%

average reduction in >PM2.5

2

atmospheric safety policies

01
background
analyzing the problem
To understand gaps in research on pediatric asthma vulnerability, I reviewed 40+ peer-reviewed studies examining how microclimatic conditions affect pediatric asthma in urban schools.
A tilted view of an academic paper titled “Evaluating the impact of urban greenness on pediatric asthma rates: Implications for school policy,” surrounded by related charts, tables, and reference pages.
A U.S. map shows asthma prevalence among children aged 0 to 17 by state, shaded in four blue gradients ranging from 4.4% to over 9.8%, with white indicating unavailable data.
distilling gaps in literature
I distilled my research findings into 4 key insights.
unclear how microclimates impact PAV
The effects of specific microclimatic parameters on pediatric asthma and how vegetation levels influence pollutant exposure remain poorly understood at the census tract level.
insufficient analysis of individual pollutants
Most studies aggregate pollutant data into broad categories (particulate matter, nitrogen oxides, volatile organic compounds), which obscures how individual pollutants or particle sizes affect asthma vulnerability.
limited exploration of microclimates
Existing research lacks analysis of how meteorological factors (temperature, humidity, wind speed) influence the dispersion and concentration of pollutants in urban schools with different densities of vegetation. While some studies correlated microclimatic conditions with pediatric asthma, none determined whether these factors directly contribute or if vegetation mediates their effects.
absence of standardized metrics
The lack of standardized metrics for assessing pediatric asthma vulnerability has produced conflicting findings and inconsistent proxies, which makes it challenging to compare studies and draw causal conclusions.
limitations of traditional aerial sensors
Current sensors are expensive and stationary since they rely on pollutants reaching fixed collection points rather than measuring concentrations where they're highest. Traditional sensors also overlook how pollutants disperse through meteorological factors like wind velocity, pressure, and temperature variations (urban heat islands, thermal inversions).
02
ends and means
method
To address these gaps, I investigated whether fine (>PM0.3) and coarse (>PM2.5) particulate matter and carbon oxides (CO and CO₂) correlate with pediatric asthma vulnerability in urban schools with low (<0.2) versus moderate (0.2-0.6) NDVI (vegetation index) at the census tract level. I tested a cost-effective, mobile AI rover equipped with Arduino-based aerial sensors for each microclimatic parameter.
variables and conditions
hypothesis
Schools with lower NDVI (vegetation) would experience higher pediatric asthma vulnerability compared to schools in more vegetated tracts due to increased exposure to particulate matter, carbon monoxide, and carbon dioxide.
independent variables
>PM0.3
>PM2.5
CO
CO₂
NDVI
dependent variables
A high PAVI indicates elevated emergency department visits and chronic obstructive pulmonary disease coupled with low preventive medication use.
macroscale PAVI = α(ED visits) + β(COPD) - γ(inhaler prescription)
experimental and control groups
I selected 5 schools in census tracts with low NDVI (<0.2) for the experimental group and 5 with moderate NDVI (0.2-0.6) as controls, with measurements at 3 sublocations per school across 2 dates.
control variables
I recorded meteorological parameters (temperature, humidity, wind speed) to ensure homogeneous conditions and defined site selection criteria to control for confounding factors.
the method behind the madness
To identify meaningful patterns in pediatric asthma vulnerability, I selected 5 experimental schools in low-NDVI census tracts and 5 control schools in moderate-NDVI tracts, then engineered a rover to measure pollutants at 3 sublocations per school across 2 dates.
180

trials

30

research sites

7

sensors engineered

selecting sites
I selected experimental schools using 6 exclusion criteria and a random forest classifier to identify schools with moderate NDVI (greenness) and exclude them to isolate the effects of sparse vegetation (low NDVI).
A choropleth map displays a city divided by neighborhood, shaded by a scale from -1.0 to 0.6 representing NDVI, with black circles marking five experimental schools and black triangles marking five control schools.
collecting data
I gathered data on the selected atmospheric parameters at 10 selected Dallas ISD schools, divided into 5 experimental and 5 control locations to test my hypothesis. To control for confounders, I conducted a total of 180 trials by collecting data at 3 designated sublocations, with 3 replicates per sublocation, on 2 dates (10 sec for 3 min/trial), for each school.
A collage of three aerial satellite images shows different high school campuses with numbered labels identifying buildings, sports fields, and surrounding areas.
rover
I engineered a novel, cost-effective, mobile rover with Arduino-based aerial sensors for each microclimatic parameter to maximize data coverage and overcome the mobility limitations of traditional aerial sensors. I self-assembled sensors using Arduino-based parts.
Two outdoor images show a DIY rover on grass, equipped with colorful wheels, electronics, sensors, and a reflective pinwheel mounted on a vertical pole.
engineering the rover
I engineered a novel, cost-effective, mobile rover with Arduino-based aerial sensors for each microclimatic parameter to maximize data coverage and overcome mobility limitations of traditional stationary sensors. Since no affordable wind speed microsensors existed, I built a proximity sensor paired with a pinwheel to count rotations over time.
A collage of three images shows a homemade rover with orange and blue wheels, various electronic components, and a mounted pinwheel, both in outdoor grassy terrain and an indoor workspace.
Final rover with sensors
A top-down image displays a small motor connected to a blue gear beside a larger black gear, placed on a flat metallic surface.
CAD 3D-printed wheels
Three close-up images show different configurations of Arduino-based electronic circuits connected with colorful jumper wires, breadboards, and sensors, including SD card modules and microcontrollers.
CO₂ and CO sensors
Three images show electronic components and microcontrollers, including an Arduino board and a breadboard circuit, with the final image featuring a hand holding a windmill-style sensor setup connected to wires in front of computer monitors.
Meteorological sensors
A close-up image shows a blue electronic sensor unit mounted on a blue bracket, with wires connected below and a blurred classroom or workshop environment in the background.
>PM2.5 and >PM0.3 sensor
Three smartphone screenshots show an environmental data app with maps of North Dallas High School with air quality metrics, including PAVI scores and PM2.5 concentrations, data collection visuals, and hotspot analysis.
processing data
After transporting the rover to each school (3 sublocations, 3 replicates, 10-second intervals for 3 minutes per trial), the rover autonomously or remotely followed a standardized path and transmitted sensor data to a mobile app.
1. Each data point is linked with specific coordinates where the rover is located.
2. Calculate spatial covariance between data points to assess how pollutant concentrations vary with distance.
3. A kriging model (covariance matrix) predicts pollutant concentrations at unmeasured locations.
4. Use DBSCAN clustering to identify pollutant hotspots by grouping proximal areas with high pollutants.
5. Gaussian pollutant dispersion model accounts for pollutant movement based on meteorological conditions.
visualizing data
The model built a spatiotemporal map of pollutant concentrations by visualizing pollutant dispersion relative to temperature, humidity, and wind speed to identify high-exposure zones.
Two smartphone screens show a map of North Dallas High School displaying predicted average PM2.5 concentrations over time, with a time slider feature allowing users to forecast pollution levels based on meteorological data.
interpreting macroscale PAVI
PAVI was highest in areas adjacent to major roads, parking lots, and building perimeters due to pollutant accumulation, reduced dispersion, and limited vegetation buffering. Lower PAVI was observed in open fields and downwind locations where pollutants disperse more freely.
A phone screen shows a pollutant heatmap of North Dallas High School with outlined zones and a color-coded microscale PAVI score, showing predicted air quality values based on meteorological conditions.
recommending interventions
The model generates recommendations on optimal intervention (e.g., vegetation, HVACs, HEPA) to reduce PAV.
A phone screen shows a map of North Dallas High School highlighting areas with recommended vegetation interventions to reduce PM2.5, suggesting tall evergreen trees planted in two staggered rows at a minimum height of 20–30 feet.
03
the magical moment
results + insights
I found that experimental schools had significantly higher levels of CO₂ and coarse PM, which strongly correlated with increased pediatric asthma vulnerability, especially in downtown and southeast Dallas. These levels were inversely related to NDVI, which suggests that areas with lower vegetation density experienced higher asthma vulnerability.
*p > 0.0001, *p ≤ 0.0001, and *p < 0.0001 represent significance values from unpaired two-sample t-tests comparing average parameter values between experimental and control groups.
27% higher >PM0.3 concentrations
55% higher >PM2.5 concentrations
2% higher CO concentrations
19% higher CO₂ concentrations
13% higher air temperature
20% higher humidity
14% higher wind speed
spatial trends
Using spatial regression analysis on census tract data, I found that experimental schools had higher pediatric asthma vulnerability compared to controls, meaning Dallas ISD schools in lower-NDVI areas had significantly higher coarse PM and CO levels. This corresponded to increased vulnerability, supporting my hypothesis.
Two maps of Dallas show pediatric asthma data: one shows emergency department visits per 90 days by neighborhood, and the other shows annual inhaler prescriptions, both shaded in blue gradients to indicate severity levels, with schools and Seagoville labeled.
experimental group
Spatial regression analysis revealed that downtown Dallas tracts showed moderately high vulnerability. Urban periphery tracts, despite proximity to downtown, showed lower vulnerability.
control group
Tracts in Seagoville showed high vulnerability, which indicated over-reliance on preventive medication due to localized environmental triggers rather than health emergencies. North Dallas showed low vulnerability, likely due to consistent healthcare access preventing acute incidents in higher-risk areas.
discussing results
I distilled my findings into 4 key insights.
coarse PM concentrations are greater in low-NDVI schools
Experimental schools with lower NDVI experienced significantly higher levels of PM (to a greater extent coarse PM), which were strongly correlated to increased PAV, especially in downtown and southeast Dallas. Vegetation filters and traps PM through stomata or leaf cell membranes. In low-vegetation areas, less filtration results in higher coarse PM levels. Coarse particles were more prevalent than fine particles because vegetation traps larger particles more easily due to their size.
CO₂ concentrations are greater in low-NDVI schools
Higher CO₂ levels in experimental locations with low NDVI suggest a reduced capacity for natural CO, absorption and sequestration capabilities found in more vegetated environments. Vegetation naturally absorbs CO, from the atmosphere through photosynthesis by converting it into oxygen, which suggests that the lack of greenery in these areas inhibits this absorption.
low vegetation density decreases PAV
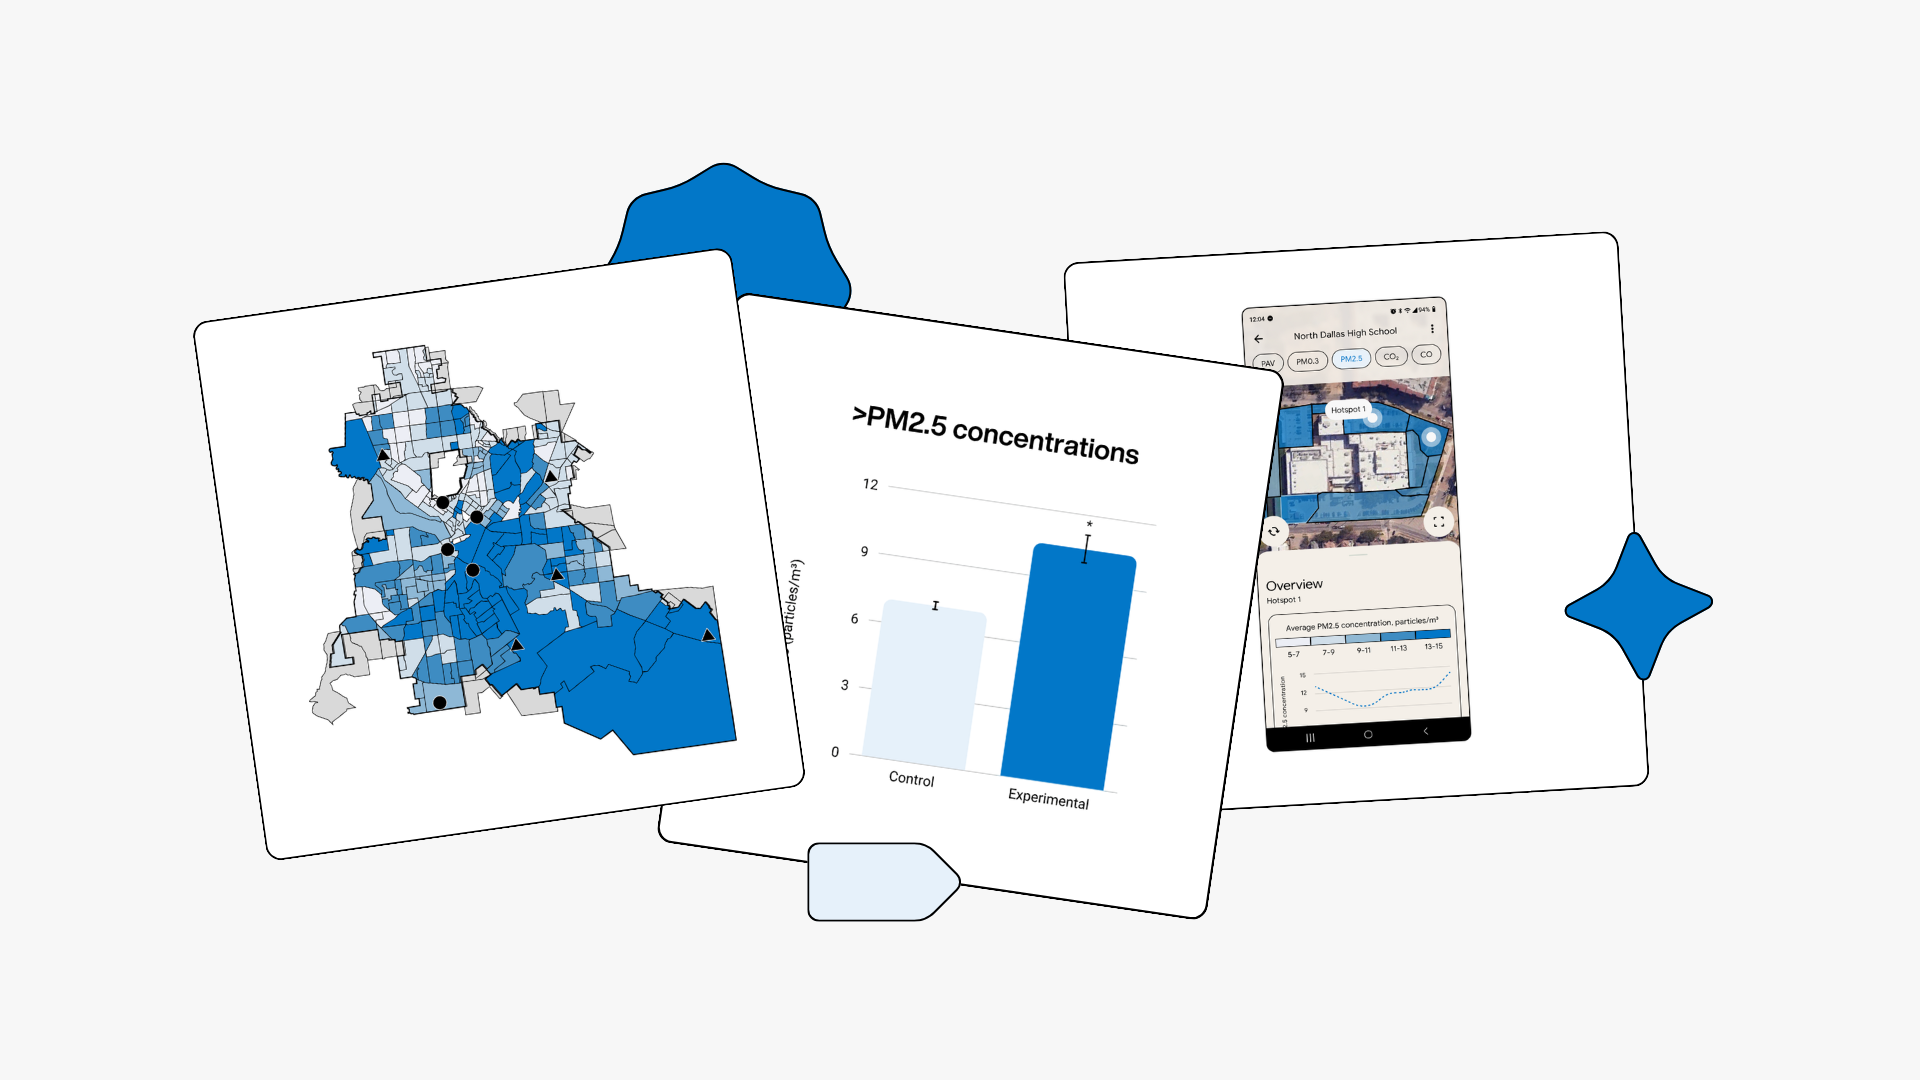
The inverse relationship between NDVI and temperature, CO₂, PM, and humidity suggests that low vegetation contributes to worse air quality and higher asthma vulnerability in experimental schools. Spatial regression analysis (r=0.72) showed significant inverse correlation between vulnerability and NDVI, while fine PM and CO₂ positively correlated with elevated vulnerability. Low greenery and high atmospheric pollutants interact to increase vulnerability.
meteorological factors mediate high-PAV microclimates
Experimental schools experienced significantly higher temperatures, which indicates strong urban heat island effects from impervious surfaces replacing vegetation. Wind flow, temperature gradients, and vegetation density created concentrated PM2.5 exposure zones near traffic-adjacent schools in low-NDVI areas.
limitations
Social determinants of health, such as higher poverty rates in experimental locations, represent confounding variables that correlate with increased chronic disease rates and could have increased asthma vulnerability independent of environmental exposures. Future studies should include more locations and control for social determinants of respiratory health.
sharing results
Finally, I used rover data to publish a paper in a Harvard-affiliated journal correlating pediatric asthma vulnerability with particulate matter in Dallas ISD schools.
DOI: 10.59720/24-269
04
significance
impact
The AI-rover system serves two purposes: For schools, it provides a cost-effective tool showing exactly when, where, and how to reduce pollutant concentrations most efficiently. For future studies, it offers a more accurate data collection method by using sensors to capture spatiotemporal variations across larger areas and time intervals.
This is the first study to assess the impact of microclimatic parameters on pediatric asthma and to integrate machine learning to spatially visualize pollutant dispersion.

PAV + AI

Three smartphone screenshots show an environmental data app with maps of North Dallas High School with air quality metrics, including PAVI scores and PM2.5 concentrations, data collection visuals, and hotspot analysis.
The rover-AI system’s portability, affordability, and intelligence informs policy decisions tailored to schools' unique microclimatic conditions rather than averaged across a ZIP code.

personalized data

Three photos show a homemade mobile rover built from electronics and cardboard, equipped with sensors, wires, and a colorful spinning pinwheel, positioned outdoors on grass.
This study’s spatial insights are being used to lobby school officials to implement 2 atmospheric safety protocols in Dallas ISD elementary schools for the 25-26 school year.

impacting policy

A set of visuals showing PM2.5 air pollution data, including a map of Dallas neighborhoods, a bar graph comparing PM2.5 concentrations between control and experimental sites, and a mobile app displaying air quality data for a school campus.
Currently deployed in 4 Dallas ISD elementary schools totaling 2.4K+ students, the rover-AI system overcomes the mobility limitations associated with traditional sensors.

impacting people

A collage of satellite images shows three elementary school campuses—David G. Burnet, Seagoville North, and Adelle Turner.
taking it into competition
In March, I placed 2nd in Earth and Environmental Sciences at the Texas Science and Engineering Fair out of 20K+ students statewide. In May, I placed 1st in Atmospheric Sciences out of 500+ students internationally at the GLOBE International Science Symposium!
GSTCA
I was also selected as 1 of 35 recipients of a $2K engineering research scholarship as a Governor’s Science and Technology Scholar.
Overlapping photo cards displaying PID trajectory tracking line graphs with oscillating blue waveforms, a circular drone flight inset, an aerial photo of SMU's red-brick campus plaza with a gold-domed building, and an altitude control signal time-series chart, on a light gray background with a navy SMU mustang badge.
from researcher to intern
Participating in nasa's globe program gave me the unique opportunity to continue researching with nasa during high school and college!
Overlapping photo cards showing a red PCA biplot of North American fungal isolates clustered by principal components, a photograph of the NASA Ames Research Center water tower, and a wildfire burn confidence probability curve comparing logistic regression and CNN model outputs, with a standard deviation formula on a light gray background with a pink blob shape.
I engineered a distributed wildfire early-warning system to produce probabilistic fire spread maps using Monte Carlo physics simulations to quantify wildfire sensitivity to vegetation, topography, and wind.
Overlapping photo cards featuring a navy blue circle with a white Longhorn logo, a photo of the UT Tower framed by orange flowering plants against a blue sky, a tilted card showing a blue-toned US map with a mathematical equation below it, and a tilted white card displaying a scatter plot and formula on a light grey background.
atmospheric physics @ nasa + ut austin
I trained graph neural networks on NASA GOES satellite images to increase accuracy of global weather forecasts for tropical cyclone paths, atmospheric rivers, and heat waves in geophysical simulations.
A collage of various electronics and robotics parts featuring Arduino boards, sensors, wires, a motor assembly, and a small outdoor rover with a pinwheel mounted on top.
I patented an AI outdoor air quality monitoring robot to reduce PM2.5 air pollutants in 4 Dallas schools, publish a Harvard-affiliated paper, and inform an atmospheric safety bill impacting 2.4K+ students.
more work
A hand wrapped in a produce wreath holds a screen with Agsight's plot overview screen.
helping 50+ vineyards and orchards respond to wildfires and climate change with AI
agsight
2024 - present